Real-time data from the Napa FBV Broadband Force-Balance Vertical Seismometer
David F. Nelson
Brett M. Nordgren
For more information: Brett Nordgren < >
>
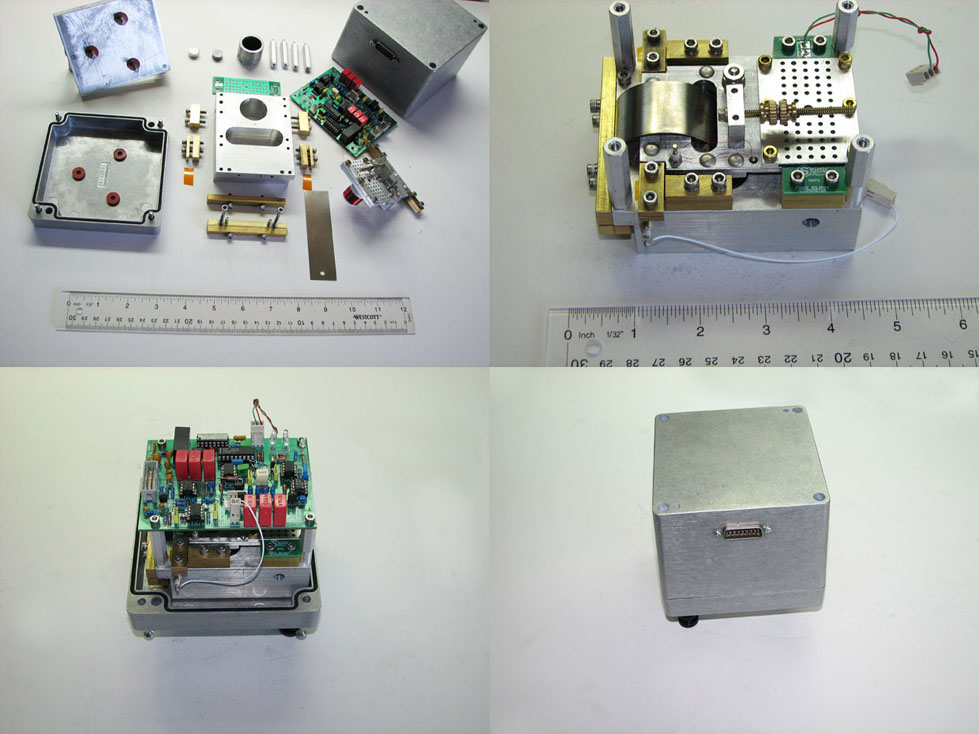
The seismic traces below are captured from the high and low gain outputs of an experimental force-balance vertical seismograph, located approximately two miles from the Pacific Ocean and 19 miles from downtown Los Angeles. The instrument is mounted on a concrete pier, which rests on shallow bedrock made up of weathered Miocene marine sediments.
The Napa's high-gain output has a sensitivity of approximately 277 V/cm/sec (27,700 V/m/sec) over a frequency range of 50 seconds to 30 Hz, while the low gain output is 5.54 V/cm/sec (554 V/m/sec) over the same bandwidth. Both outputs are connected to inputs of a 16-bit digitizer, which clip at a level of 10 Volts, representing 360μm/sec for the high gain channel and 1.8cm/sec for the low gain one.
The images below are created using differing gain settings and differing low-pass filter settings and are updated every 5 minutes.
High gain channel
418nm/sec/line WinSDR Y-scale factor = 1 50sec – 14.3sec (0.07Hz) Clipping level 360μm/sec.
These settings greatly reduce microseisms and cultural noise although they also eliminate higher-frequency local quakes and may mask some phases of teleseisms. However the sensitivity is sufficient to occasionaly display surface waves originating from distant quakes having magnitudes in the high 4's, low 5's. Large quakes will be off screen, although the channel clipping level (10V) is still 360μm/sec. or 36x this screen height.
Low gain channel
20.9μm/sec/line WinSDR Y-scale factor = 1 50sec – 5Hz Clipping level 1.8 cm/sec
These settings clearly show some cultural noise, which tends to get smaller at night. Higher-frequency local quakes show up well on this display and large teleseisms are also well displayed.
Noise
Below is a plot (blue) of the internal noise estimate for Napa prototype #2, expressed as acceleration Power Spectral Density, made using an HP 35665 Signal Analyzer.
Two common low noise models are plotted for comparison. The New Low earth Noise Model, NLNM, (Peterson, 1993) is a composite of the lowest earth noise levels observed the best stations, worldwide. The Mode Low earth Noise Model, MLNM, (McNamara, 2004) represents the noise level typical of the best USNSN and ANSS stations in the United States. The green curve is the noise estimate for a Trillium 120P located adjacent to the Napa, while the yellow curve is the total ground noise as observed by the Trillium 120P.
Comparisons
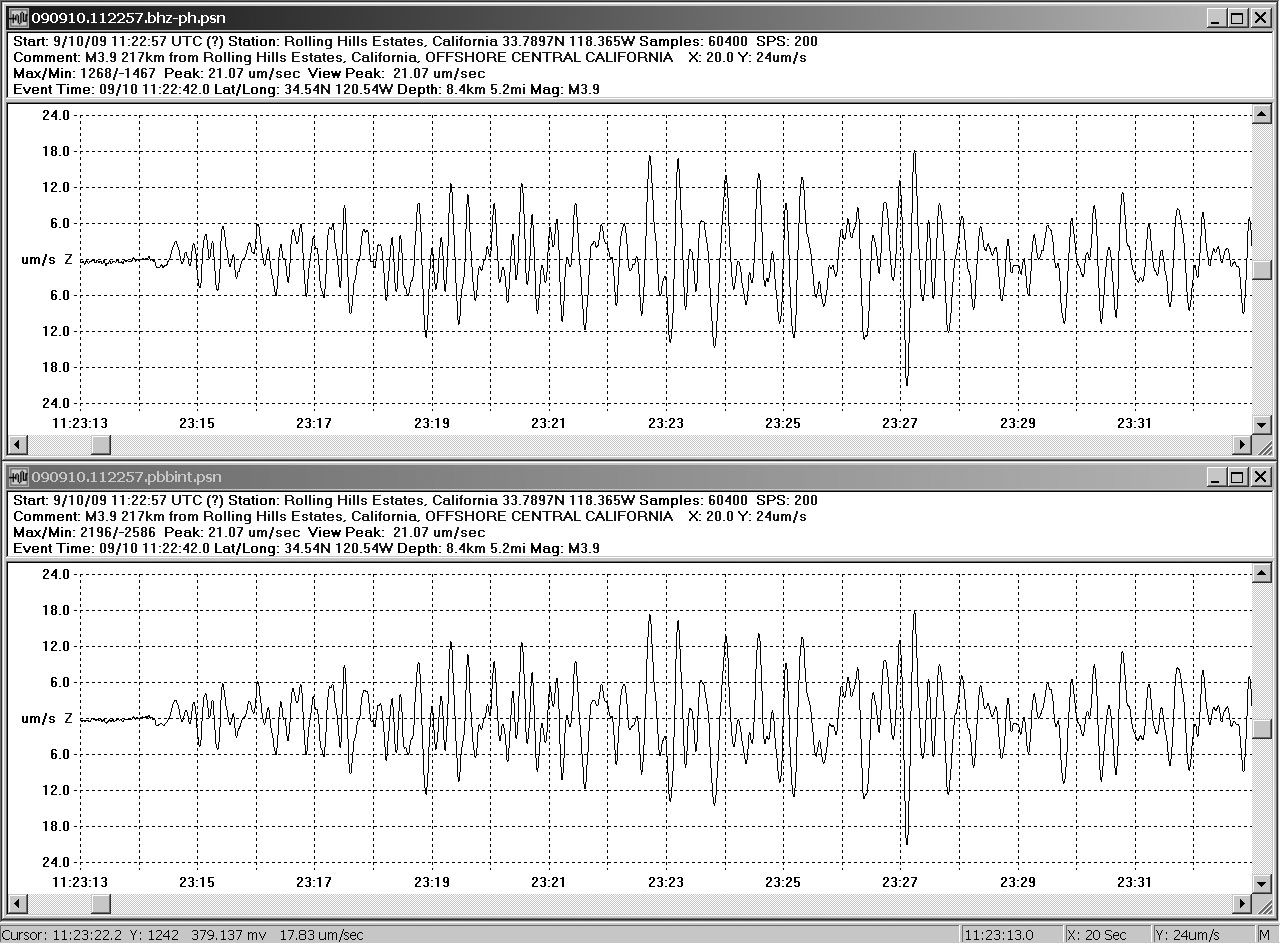
A comparison of the waveforms from 20 second recordings of a local M3.9 filtered 50sec-20Hz.
The upper trace is from the Force Balance Vertical and the lower trace is from a Nanometrics Trillium Compact 120.
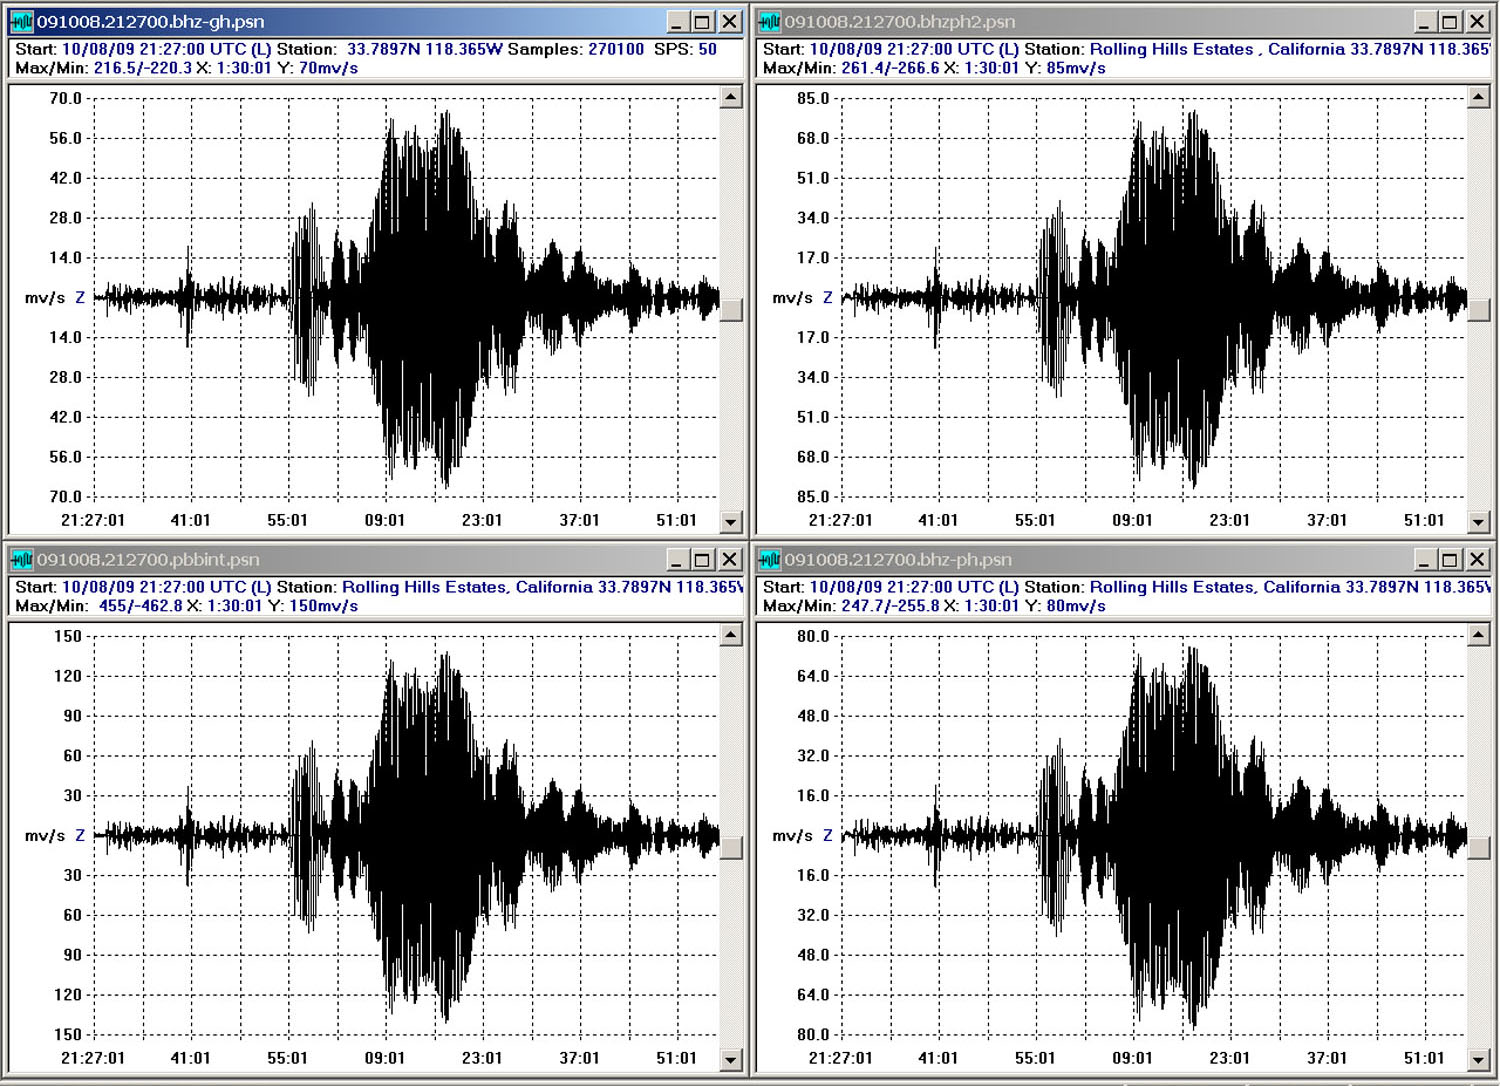
A comparison of four instruments displaying 90 minutes of the 8 October, 2009 Santa Cruz Islands M6.2. Upper Left: Ancient Guralp CMG-3. Lower Left: Trillium Compact 120. Upper and Lower Right: Two Force Balance Verticals.
The acid test. A quiet day bandpass filtered 50 sec -12.5 sec. Sensitivity ~5nm/s/count The difference between the two traces is the sum of the instrument noise of the Trillium and the FBV, so it appears that neither can have noise greater than ~5 nm/s in the 0.06Hz band, centered at 0.04Hz.
The upper trace is from the Force Balance Vertical and the lower trace is from a Nanometrics Trillium Compact 120.
McNamara, D.E. and R.P Buland (2004), Ambient noise levels in the continental United States, Bull. Seismol. Soc. Am, 94(4), 1517 1527.
Peterson, Jon (1993), Observations and modeling of seismic background noise, U.S. Geol. Surv. Open-File Rept. 92-302.
Ringler, A.T. and C.R. Hutt (2010), Self-Noise Models of Seismic Instruments, Seismological Research Letters, 81(6), 972 983